

Z.20 - On The Map

I’ve always had a weak spot for a good map.
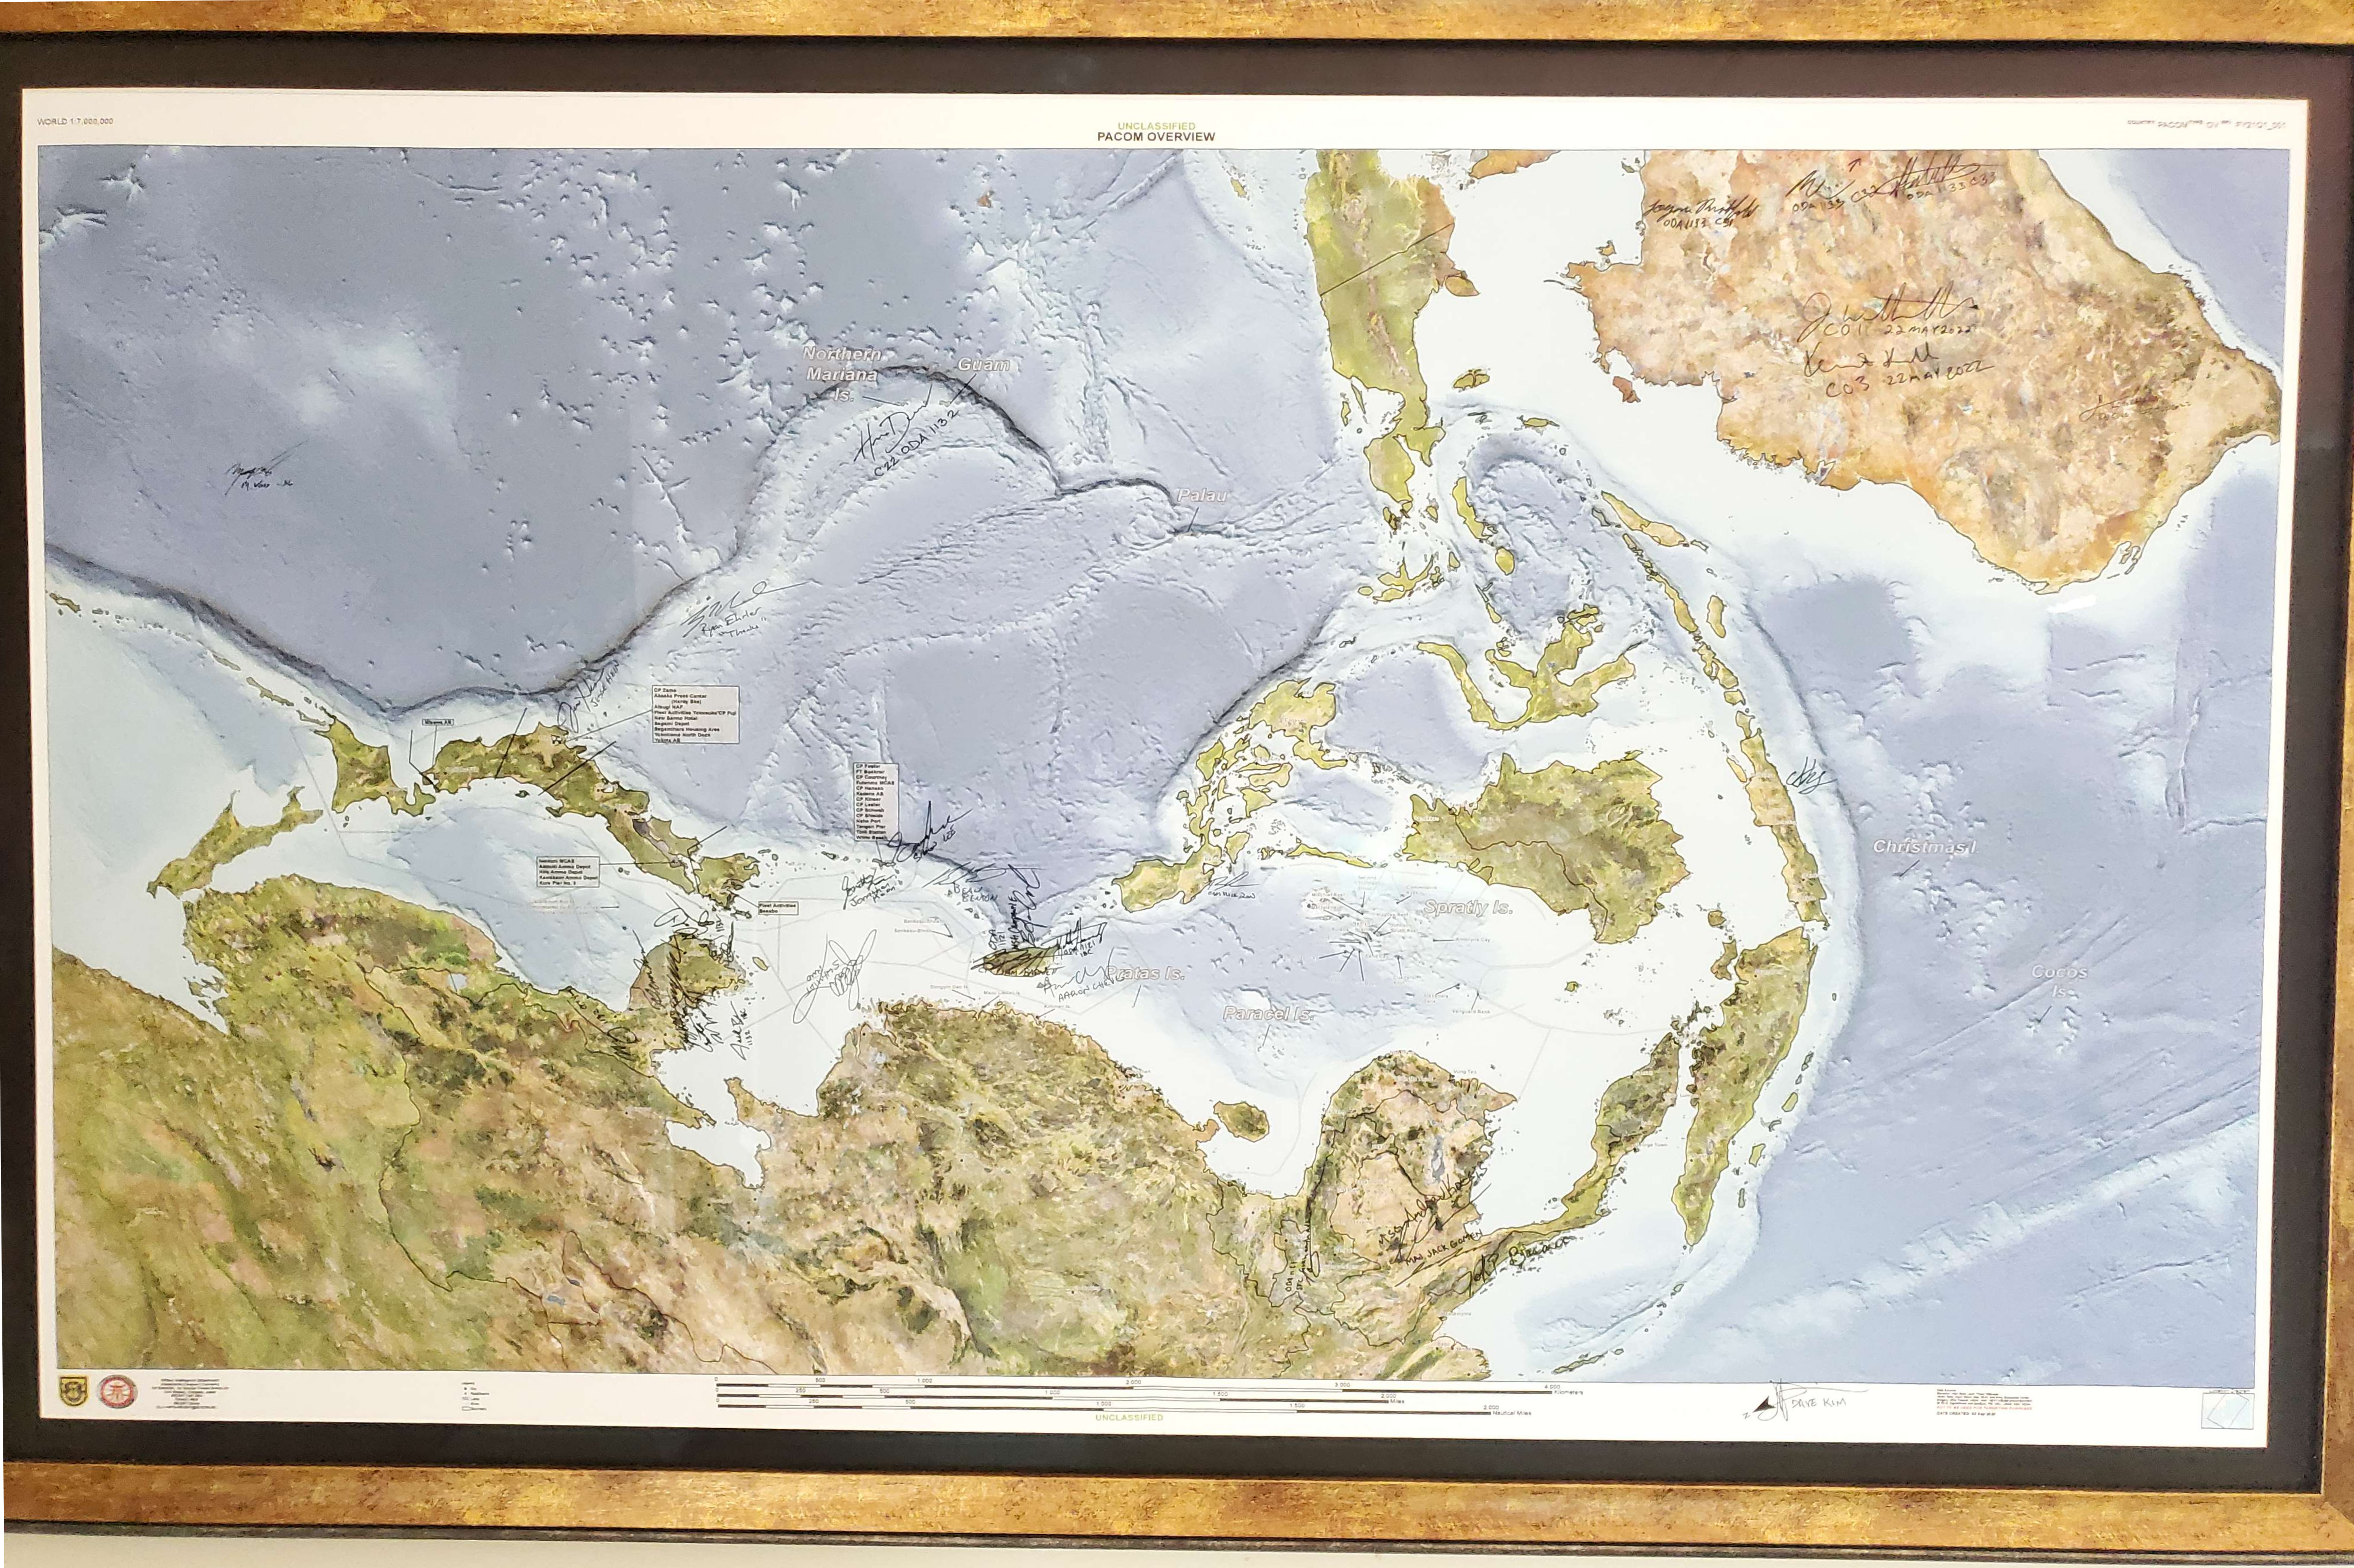
Maps are the original data visualization. They distill data into visuals that reveal as much about their creators as the worlds they depict. They even make better going-away gifts than stiff, boring plaques.On my last combat tour in Iraq, we’d worked with the Intel shop to make a great map which ran almost the entire length of the back wall in the JOC. With just the right amount of terrain detail and key landmarks marked, it wasn’t the cluttered mess too many military made maps devolve into. We translated the map onto almost all our products, and as people began to rotate out, we started printing smaller ones that the team could sign. Half the fun was picking the perfect spot on the map for your John Hancock.
To the USMC Fires Officer: ‘Your fires career culminated here!’
After leaving Iraq, I took the simple style of that map with me to my command in Okinawa. The map at the top of this post is a reproduction of the one I used when in command in Okinawa. I stole the orientation from our Japanese partners, who turned theirs 90⁰ in their 2020 defense white paper. The work version — which still hangs in the 1-1 commander’s office — has all the PRC and US bases marked, as well as every C130 capable airfield. Like I said, maps tell us a lot about who made them too.
The map hung on the wall behind me. About a week after it was printed my operations officer was joining me in my office for a VTC when he abruptly exclaimed, ‘I get it now!’ That map did more to explain the PRC’s strategy in the Western Pacific than any 40 page white paper ever did.
I’m not the only one with an affinity for maps. Two fellow substacks recently posted their own homages to maps. James Lucas’ Beauty is Truth examines 10 maps that inspire awe not just for their art, but for their history.

Ancient maps were often born from heroic exploration, yet their true magic extends far beyond the feats themselves. They also carry us back to a time before satellites, before GPS, when the world was vast and mysterious.
In the same vein as the map we made in Okinawa, CDR Salamander beats the drum on the need for our military to understand the sea we need to cross just to reach a fight in Asia.

For the PRC, the primary military threat to plan for comes across the1 Pacific into a funnel that terminates at its most important SLOC. It’s the United States of America, and the US has a series of islands leading right into the heart of the PRC’s. It starts in Hawaii — Midway, Wake, Guam — and then to U.S. allies: the Philippines, Japan, and Australia.
I’d been thinking about maps before I read Lucas’ and Sal’s posts. My new job meant new products, and I wasn’t happy with the pixelated maps on the ones we were using. So I went looking to repeat the process I’d run back in Oki.
Except the Army doesn’t have GEOInters up here in Honshu. Not in the garrison, nor in the Intel battalion across the street. Having struck out through the traditional path, I went hunting elsewhere.
Following a Reddit thread led me to this superb tutorial by joewdavis on github. A weekend of learning and tinkering later and I had new background maps:
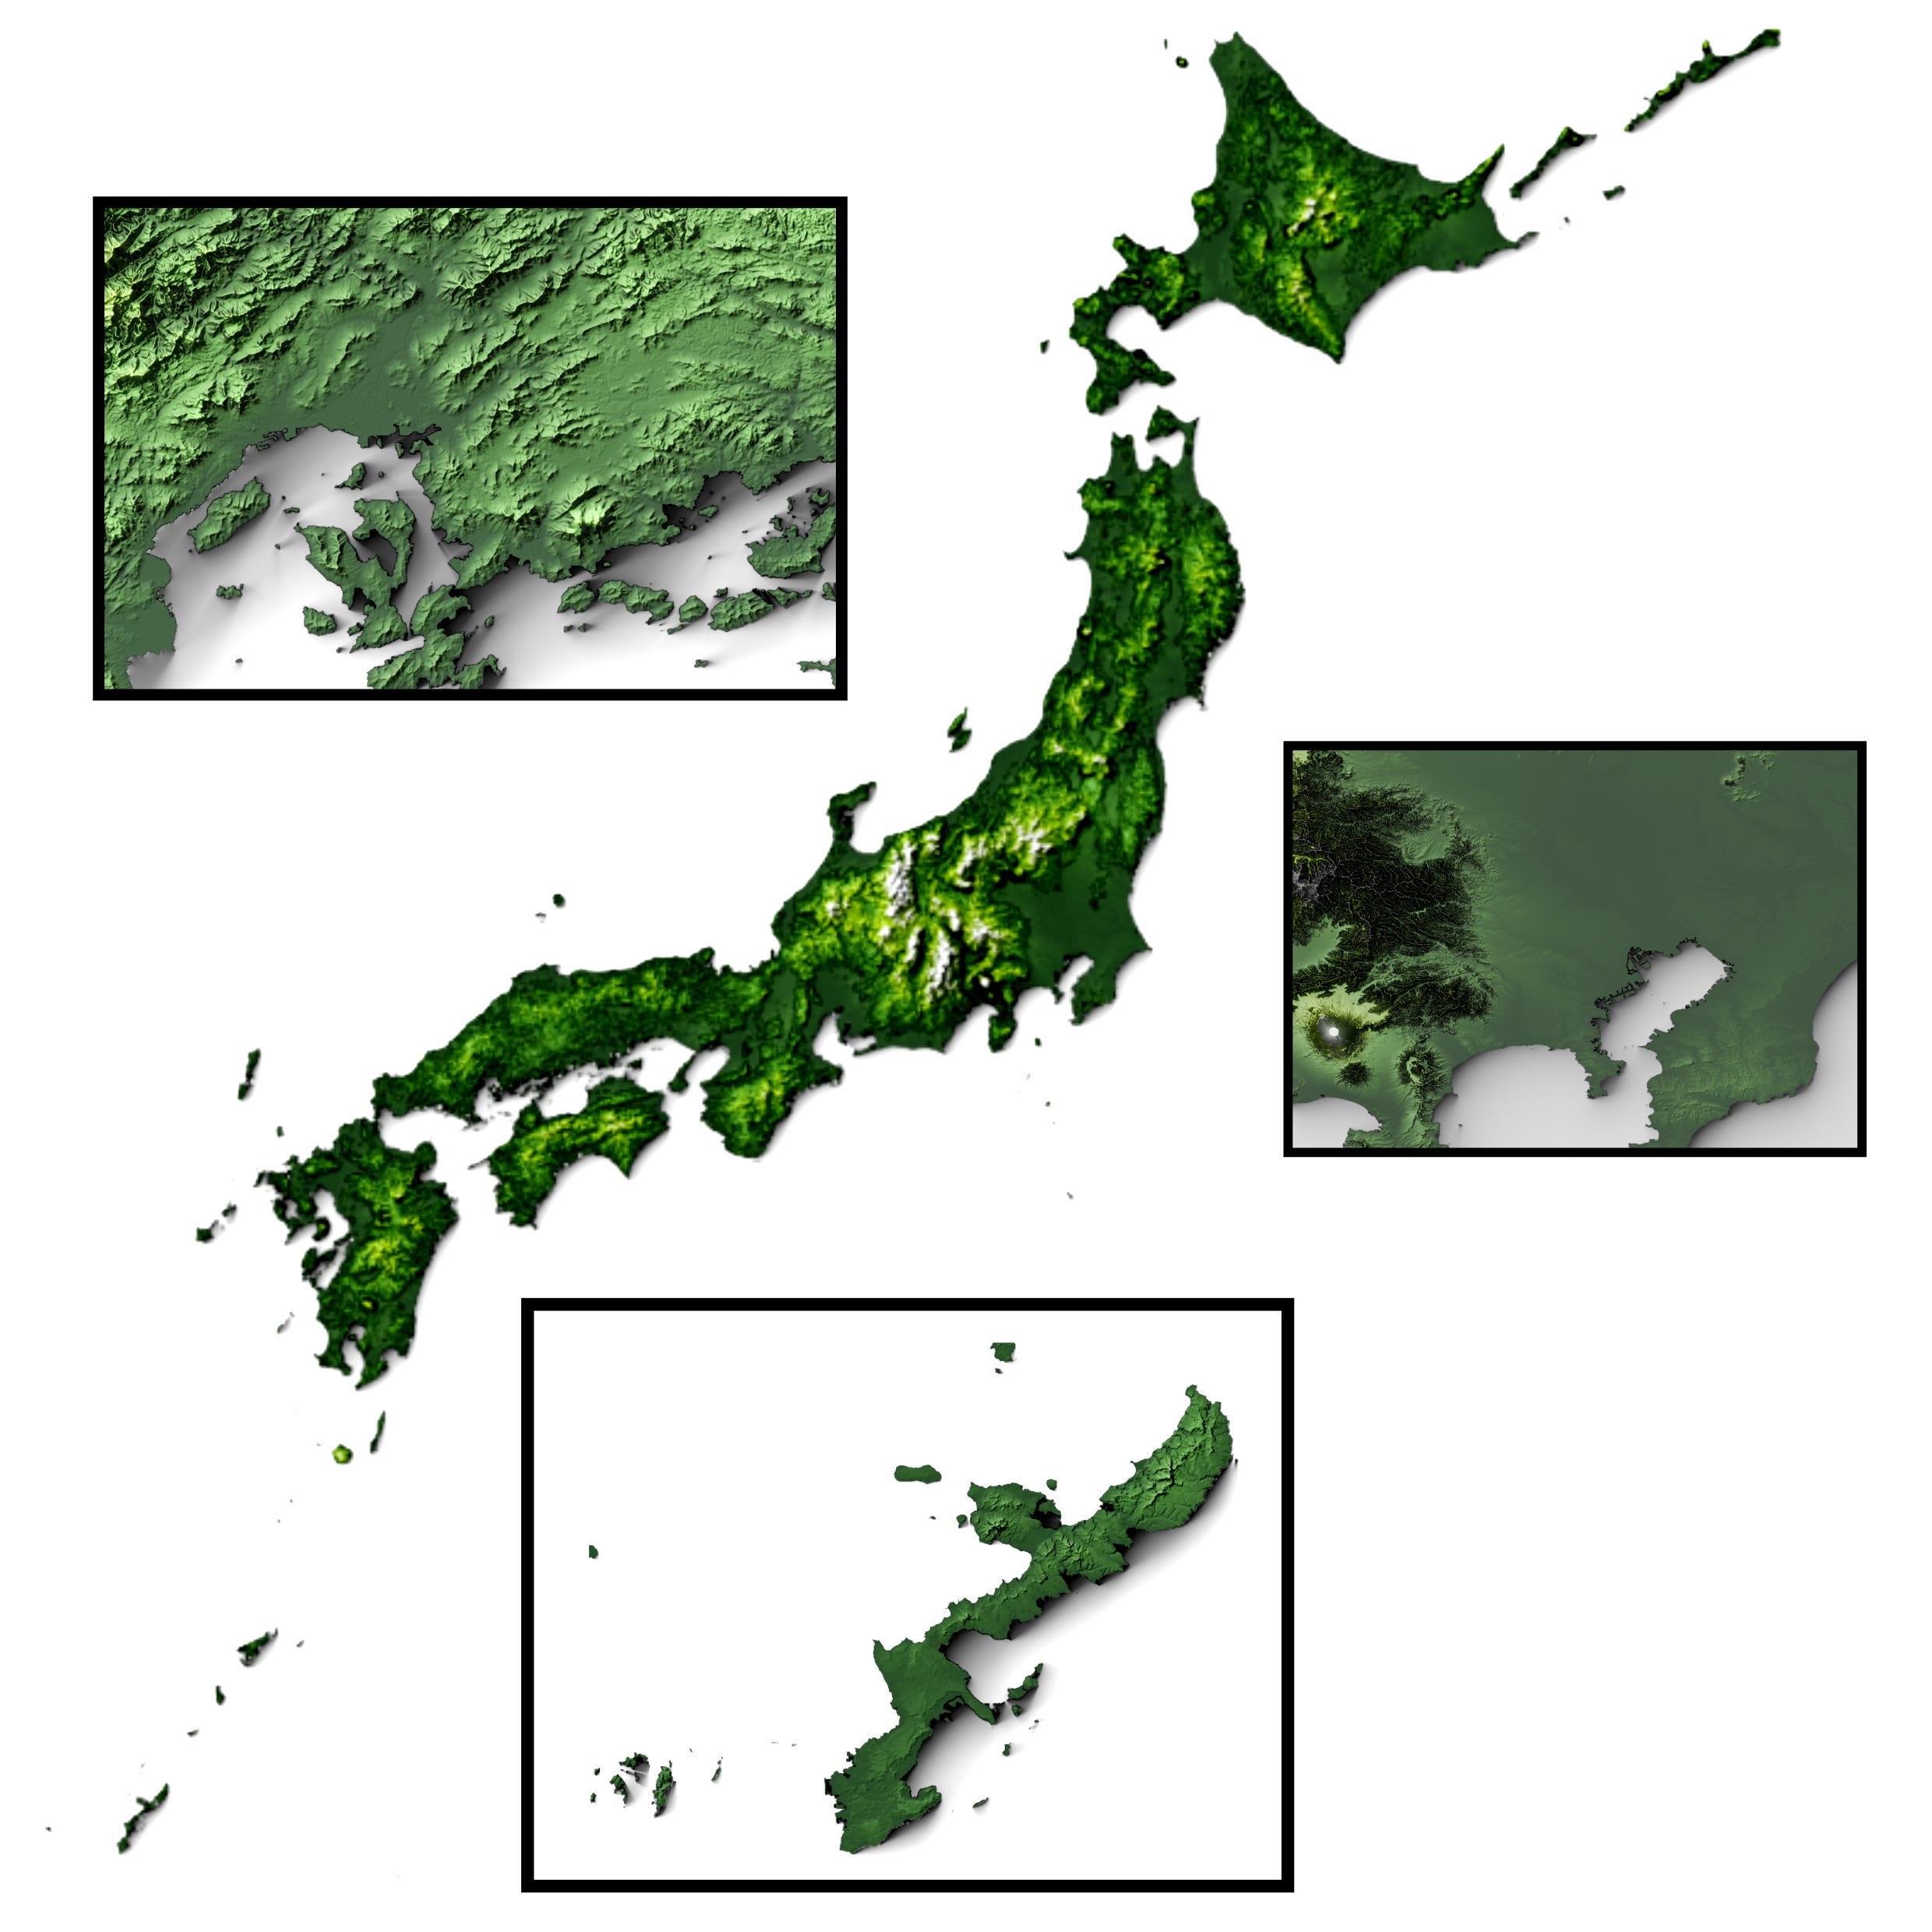
What was remarkable about this wasn’t that I made a map. Anyone can make one. That is what is remarkable to me.
I put my first toe into 3D modeling as an undergraduate in 2001. Back then, 3DSMax cost over $3,000, and ArcGIS was just as expensive. And most critically, the geographic data I needed for the map was definitely not available at a few key strokes. I don’t even know where to start calculating the cost of acquiring LIDAR maps of an entire archipelago in the early 2000s, but it would likely have been several hundred dollars.
Two decades later the cost of the entire project plummeted from more than $6,000 and weeks of work down to about 5 hours of YouTube and self-study, and barely $1 of electricity. What used to take a team of different Army soldiers is now only a Reddit tutorial away.
The growth of ML data models shows similar trends. While the news continues to chase each new mega-model release of the big AI firms, there are thousands of micro-models freely available on the internet today. I didn’t pay a penny more than the cost of electricity to make ‘Trooper’ with Stable Diffusion. I didn’t need a bleeding edge H200 card; instead using the GTX 1070 I purchased back in 2017.
The plunge in costs of sense and strike are part of this trend, with more and more data becoming opensource. The impacts are huge, but only if we take advantage of them. Where should you be looking for data to inform your operations? What new tools are available which can help you visualize, manipulate, and update that data? What more can your team do when jobs which used to take a dozen soldiers working for hours now take a single person — or agent — minutes?
It’s uncharted territory, and I don’t pretend to know the best way forward. But I do know we won’t get there led by data illiterate leaders who keep writing ‘hic sunt dracones’ on their maps. We need leaders who are driven to explore those unknown blank spots.
Geographic Intelligence. Intel soldiers who make maps.
Never a bad time to flag "Thinking in Space" by Andrew Rhodes for those who want to get more from their maps...
https://tnsr.org/2019/11/thinking-in-space-the-role-of-geography-in-national-security-decision-making/
My brother, I don't need many maps these days. I do however spend a lot of time looking a nautical charts. I've got two laminated blow ups of the Neuse river to assist me in learning it in depth. Depth matters here much more than the sound. I was very used to sailing in 100's of feet of water and now well 20' is deep. It just so happens than the upper and lower Neuse charts both have my place on them. One of the two is always the placemat on my desk for daily reading. Merry Christmas my friend.